

.png)


Yes, it's true. We're obsessed with all things analytics and reporting here at Visitt, and for good reason. Leveraging portfolio-wide data is simply essential for optimizing your bottom line. By comparing operational metrics and tenant satisfaction across different properties, portfolio and asset managers can quickly spot underperforming teams, equipment and processes and predict tenant satisfaction in the long run, and analyze the gaps to transform them into actionable insights for each individual property.
This month, we're thrilled to take the next step in expanding our portfolio-wide reporting capabilities with new, side-by-side comparison features. Whether it's drilling down to work order completion, tenant satisfaction ratings or preventative maintenance and equipment performance, these new reports will empower management to make impactful decisions, in real time.
Ready to take a look?
🏙️Side by Side Building Operations Reports
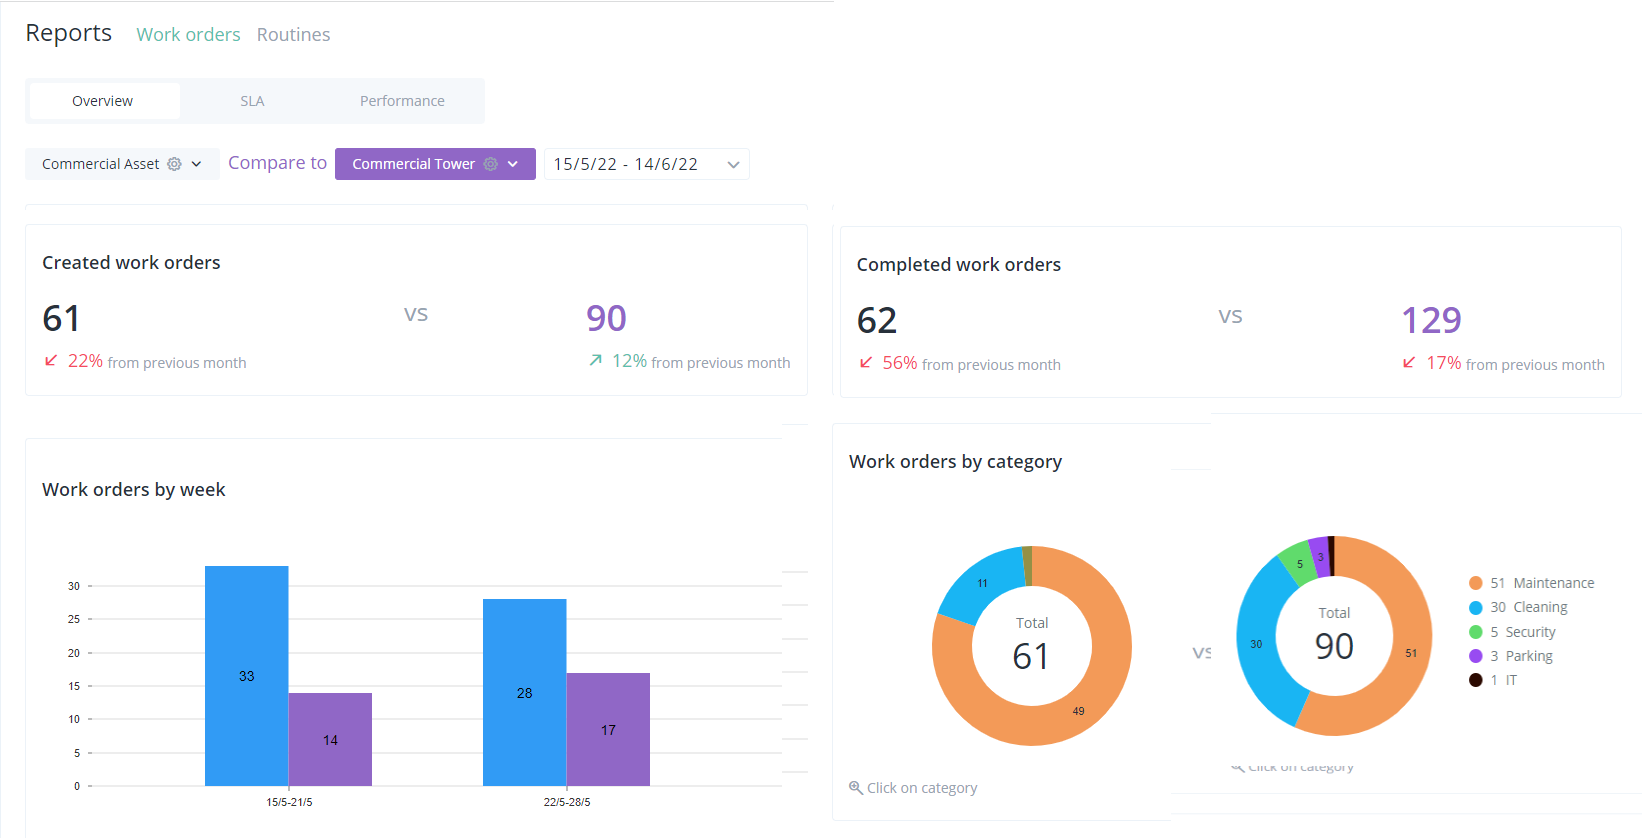
Managing your portfolio performance at a glance is easier than ever, with our new "Side by Side Comparison" reports. If you've ever wanted quick, accurate, real-time views comparing operational health throughout your portfolio - we've got just the thing!
By selecting two properties, or two groups of properties, you can easily drill down and compare assets in different geographic regions, properties managed by different teams or management companies, or properties from different verticals (like office vs multifamily). All done in a click.Here are just some of the metrics you can compare in this live dashboard:
⚙️
Equipment Performance Report
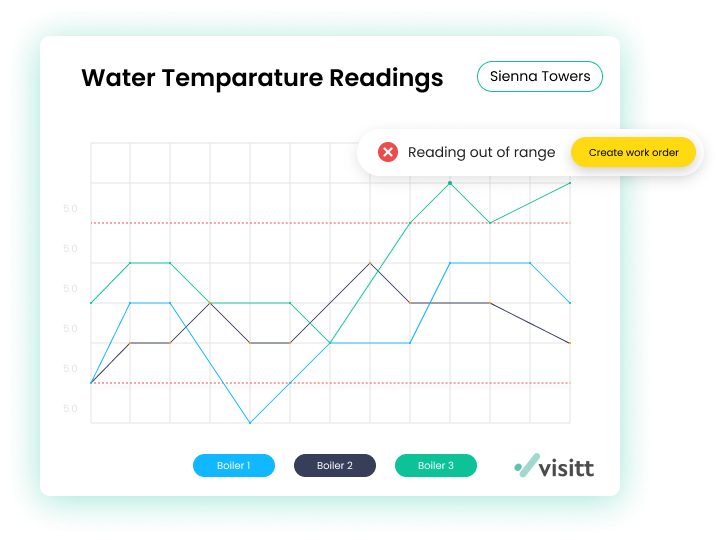
Spotting underperforming equipment in time can reduce costs by up to 40%. Our new Equipment Performance Report helps your teams do just that and more!
With Visitt, maintenance teams can quickly set thresholds at scale, document readings on the go, and get real time alerts when readings are below standard. All activities are visualized in a real-time report to make it quick and easy to spot underperforming assets and analyze trends over time
→ Set standards and thresholds for equipment performance at scale, portfolio-wide
→ Side by side comparisons of equipment performance and trends within or between sites
→ Proactive troubleshooting of underperforming assets with threshold alerts and work order creation in the field
📴Offline Mode
Work doesn't end when data or Wi-Fi service becomes unavailable in the field. With our new offline mode, your engineers and maintenance teams can proceed with their daily rounds uninterrupted, by continuing to document readings and updating work order or routine task progress in the Visitt app. All data will be recorded and synced once online service is restored.
⭐Routine Task Prioritization
By popular demand, you can now sort your "Routines" (recurring preventative maintenance or inspection tasks) by order of the various sites you want them performed in. We've also added the due date of each Routine task in it's drilldown page for improved oversight.
See you next month!
❤️ Team Visitt